By: The Deltix Quantitative Research Team
Introduction
This paper describes the implementation of an automated quantitative equity trading strategy based on sentiment factors derived from Twitter and the results from back-testing this strategy. The sentiment factors were provided by Social Market Analytics (SMA). SMA produces a family of metrics, called S-Factors™, designed to capture the signature of financial market sentiment. SMA applies these metrics to data captured from Twitter to estimate sentiment for indices, sectors, and individual securities; yielding and recording time series of these measurements on daily and intraday time scales.
We implemented the strategy in the Deltix QuantOffice research platform, a purpose-built C# development studio with embedded math, statistics and data libraries.
The strategy, which uses SMA’s intraday S-Scores, generates trading signals based on the S-Score trend-lines. We applied industry standard moving average methodology for S-Score time-series data and established trend-lines by comparing slow and fast moving averages. In addition we generated several filters to improve signal accuracy.
We made a series of experiments on the members of S&P100 index from December 2011 till March 2013. We compared the following scenarios:
a) Open a position using day open price
b) Open a position at 9:32am using current price
In addition, we added a hedging rule against the market using the SPY ETF and investigated the impact of hedging for each of the above scenarios. In the consolidated results table below, “H+” means with hedging, “H-”means without.
The results of the backtesting showed Information Ratios between 3.0 and 3.72 across the four scenarios tested. The primary effects of hedging were to reduce average profit per share and drawdown amounts.
Consolidated results
| SP100, H-, | S&P100, H+, | S&P100, H-, | S&P100, H+, | |
|---|---|---|---|---|
| gap 0.5% | gap 0.5% | 9.32, gap 0.5% | 9.32, gap 0.5% | |
| Hedging | FALSE | TRUE | FALSE | TRUE |
| Average Profit per Share | 0,08 | 0,04 | 0,08 | 0,03 |
| Information Ratio | 3,31 | 3,72 | 3,31 | 3,3 |
| Net Profit/Loss | 3,601.19 | 2,089.43 | 3,668.97 | 1,711.99 |
| Total Profit | 9,058.92 | 11,376.36 | 8,788.86 | 10,922.18 |
| Total Loss | -5,457.73 | -9,286.93 | -5,119.88 | -9,210.19 |
| Cumulated Profit % | 3.60% | 2.09% | 3.67% | 1.71% |
| Max Drawdown | -338,39 | -126,02 | -339,28 | -171,73 |
| Max Drawdown % | -0.33% | -0.12% | -0.33% | -0.17% |
| Max Drawdown Date | 4-May-2012 | 4-May-2012 | 4-May-2012 | 13-Dec-2012 |
| Return/Drawdown Ratio | 10,64 | 16,58 | 10,81 | 9,97 |
| Drawdown Days % | 62.46% | 63.36% | 62.46% | 66.67% |
| Max Drawdown Duration | 36 | 39 | 42 | 39 |
| CAGR | 2.80% | 1.63% | 2.85% | 1.33% |
| Sharpe Ratio | 3,31 | 3,72 | 3,31 | 3,3 |
| Annualized Volatility | 0,85 | 0,44 | 0,87 | 0,41 |
| Sortino Ratio | 6,17 | 8,31 | 6,6 | 7,19 |
| UPI | 1,81 | 2,28 | 1,77 | 1,51 |
| Information Ratio | 3,31 | 3,72 | 3,31 | 3,3 |
| Optimal f | 388,54 | 845,22 | 380,3 | 812,9 |
| All Trades # | 1598 | 1842 | 1599 | 1844 |
| Profitable Trades Ratio | 0,58 | 0,55 | 0,57 | 0,55 |
| Winning Trades # | 922 | 1020 | 915 | 1019 |
| Losing Trades # | 676 | 822 | 684 | 825 |
| Average Trade | 2,25 | 1,13 | 2,29 | 0,93 |
| Average Winning Trade | 9,83 | 11,15 | 9,61 | 10,72 |
| Average Losing Trade | -8,07 | -11,3 | -7,49 | -11,16 |
| Avg. Win/ Avg. Loss Ratio | 1,22 | 0,99 | 1,28 | 0,96 |
| Average Profit per Share | 0,08 | 0,04 | 0,08 | 0,03 |
Detailed results
1. Open position at day open time
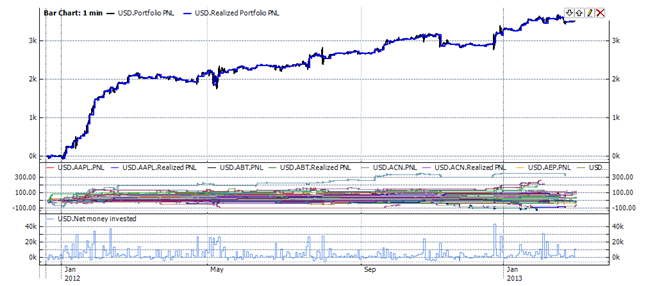
Performance report:
| Parameter | All Trades | Long Trades | Short Trades |
|---|---|---|---|
| Net Profit/Loss | 3,601.19 | 3,768.95 | -167,77 |
| Total Profit | 9,058.92 | 8,316.09 | 742,82 |
| Total Loss | -5,457.73 | -4,547.14 | -910,59 |
| Cumulated Profit % | 3.60% | 3.77% | -0.17% |
| Max Drawdown | -338,39 | -338,39 | -206,71 |
| Max Drawdown % | -0.33% | -0.33% | -0.21% |
| Max Drawdown Date | 4-May-2012 | 4-May-2012 | 3-Aug-2012 |
| Return/Drawdown Ratio | 10,64 | 11,14 | -0,81 |
| Drawdown Days % | 62.46% | 60.66% | 89.79% |
| Max Drawdown Duration | 36 | 40 | 299 |
| CAGR | 2.80% | 2.93% | -0.13% |
| Sharpe Ratio | 3,31 | 3,53 | -0,73 |
| Annualized Volatility | 0,85 | 0,83 | 0,18 |
| Sortino Ratio | 6,17 | 6,69 | -0,93 |
| UPI | 1,81 | 2,31 | -0,05 |
| Information Ratio | 3,31 | 3,53 | -0,73 |
| Optimal f | 388,54 | 422,1 | -404,48 |
| All Trades # | 1598 | 1449 | 149 |
| Profitable Trades Ratio | 0,58 | 0,59 | 0,49 |
| Winning Trades # | 922 | 849 | 73 |
| Losing Trades # | 676 | 600 | 76 |
| Average Trade | 2,25 | 2,6 | -1,13 |
| Average Winning Trade | 9,83 | 9,8 | 10,18 |
| Average Losing Trade | -8,07 | -7,58 | -11,98 |
| Avg. Win/ Avg. Loss Ratio | 1,22 | 1,29 | 0,85 |
| Average Profit per Share | 0,08 | 0,1 | -0,03 |
| Max Conseq. Winners | 21 | 20 | 7 |
| Max Conseq. Losers | 20 | 20 | 7 |
2. Open position at day open time, hedged version
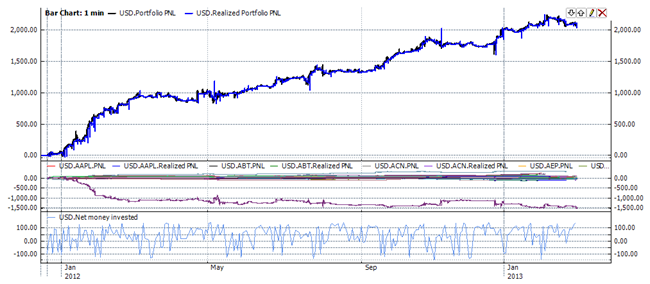
Performance report:
| Parameter | All Trades | Long Trades | Short Trades |
|---|---|---|---|
| Net Profit/Loss | 2,089.43 | 3,819.76 | -1,730.33 |
| Total Profit | 11,376.36 | 8,610.22 | 2,766.13 |
| Total Loss | -9,286.93 | -4,790.47 | -4,496.46 |
| Cumulated Profit % | 2.09% | 3.82% | -1.73% |
| Max Drawdown | -126,02 | -382,58 | -1,730.33 |
| Max Drawdown % | -0.12% | -0.37% | -1.73% |
| Max Drawdown Date | 4-May-2012 | 7-Nov-2012 | 1-Mar-2013 |
| Return/Drawdown Ratio | 16,58 | 9,98 | -1 |
| Drawdown Days % | 63.36% | 61.86% | 89.79% |
| Max Drawdown Duration | 39 | 41 | 299 |
| CAGR | 1.63% | 2.97% | -1.35% |
| Sharpe Ratio | 3,72 | 3,55 | -2,04 |
| Annualized Volatility | 0,44 | 0,84 | 0,66 |
| Sortino Ratio | 8,31 | 6,7 | -2,71 |
| UPI | 2,28 | 2,02 | -0,06 |
| Information Ratio | 3,72 | 3,55 | -2,04 |
| Optimal f | 845,22 | 421,79 | -307,84 |
| All Trades # | 1842 | 1499 | 343 |
| Profitable Trades Ratio | 0,55 | 0,58 | 0,43 |
| Winning Trades # | 1020 | 872 | 148 |
| Losing Trades # | 822 | 627 | 195 |
| Average Trade | 1,13 | 2,55 | -5,04 |
| Average Winning Trade | 11,15 | 9,87 | 18,69 |
| Average Losing Trade | -11,3 | -7,64 | -23,06 |
| Avg. Win/ Avg. Loss Ratio | 0,99 | 1,29 | 0,81 |
| Average Profit per Share | 0,04 | 0,1 | -0,12 |
| Max Conseq. Winners | 12 | 20 | 5 |
| Max Conseq. Losers | 16 | 20 | 11 |
3. Open positions at 9.32am
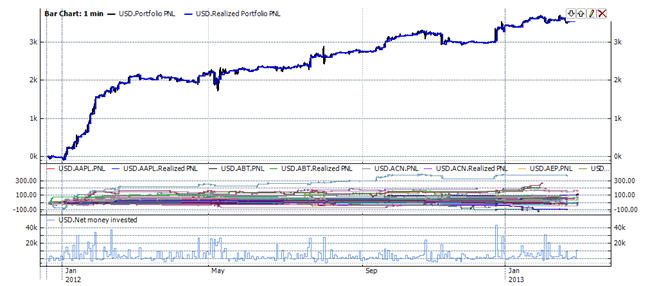
Performance report:
| Parameter | All Trades | Long Trades | Short Trades |
|---|---|---|---|
| Net Profit/Loss | 3,668.97 | 3,861.32 | -192,34 |
| Total Profit | 8,788.86 | 8,073.09 | 715,77 |
| Total Loss | -5,119.88 | -4,211.77 | -908,11 |
| Cumulated Profit % | 3.67% | 3.86% | -0.19% |
| Max Drawdown | -339,28 | -339,28 | -200,74 |
| Max Drawdown % | -0.33% | -0.33% | -0.20% |
| Max Drawdown Date | 4-May-2012 | 4-May-2012 | 21-Feb-2013 |
| Return/Drawdown Ratio | 10,81 | 11,38 | -0,96 |
| Drawdown Days % | 62.46% | 59.76% | 89.79% |
| Max Drawdown Duration | 42 | 42 | 299 |
| CAGR | 2.85% | 3.00% | -0.15% |
| Sharpe Ratio | 3,31 | 3,55 | -0,84 |
| Annualized Volatility | 0,87 | 0,85 | 0,18 |
| Sortino Ratio | 6,6 | 7,22 | -1,05 |
| UPI | 1,77 | 2,13 | -0,06 |
| Information Ratio | 3,31 | 3,55 | -0,84 |
| Optimal f | 380,3 | 415,71 | -466,28 |
| All Trades # | 1599 | 1450 | 149 |
| Profitable Trades Ratio | 0,57 | 0,58 | 0,48 |
| Winning Trades # | 915 | 843 | 72 |
| Losing Trades # | 684 | 607 | 77 |
| Average Trade | 2,29 | 2,66 | -1,29 |
| Average Winning Trade | 9,61 | 9,58 | 9,94 |
| Average Losing Trade | -7,49 | -6,94 | -11,79 |
| Avg. Win/ Avg. Loss Ratio | 1,28 | 1,38 | 0,84 |
| Average Profit per Share | 0,08 | 0,1 | -0,04 |
| Max Conseq. Winners | 21 | 20 | 7 |
| Max Conseq. Losers | 20 | 20 | 10 |
4. Open positions at 9.32am, hedged version
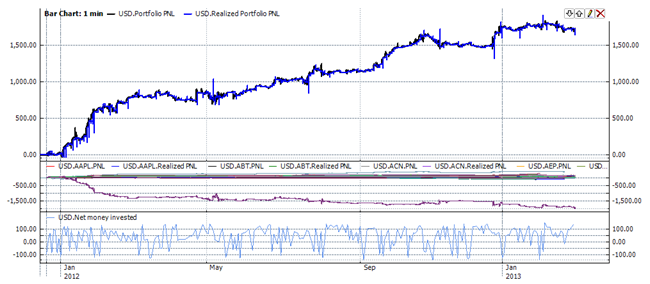
Performance report:
| Parameter | All Trades | Long Trades | Short Trades |
|---|---|---|---|
| Net Profit/Loss | 1,711.99 | 3,900.98 | -2,188.99 |
| Total Profit | 10,922.18 | 8,352.47 | 2,569.72 |
| Total Loss | -9,210.19 | -4,451.49 | -4,758.71 |
| Cumulated Profit % | 1.71% | 3.90% | -2.19% |
| Max Drawdown | -171,73 | -414,77 | -2,188.99 |
| Max Drawdown % | -0.17% | -0.40% | -2.19% |
| Max Drawdown Date | 13-Dec-2012 | 8-Nov-2012 | 1-Mar-2013 |
| Return/Drawdown Ratio | 9,97 | 9,41 | -1 |
| Drawdown Days % | 66.67% | 60.96% | 89.79% |
| Max Drawdown Duration | 39 | 42 | 299 |
| CAGR | 1.33% | 3.03% | -1.71% |
| Sharpe Ratio | 3,3 | 3,56 | -2,5 |
| Annualized Volatility | 0,41 | 0,86 | 0,68 |
| Sortino Ratio | 7,19 | 7,21 | -3,1 |
| UPI | 1,51 | 1,87 | -0,07 |
| Information Ratio | 3,3 | 3,56 | -2,5 |
| Optimal f | 812,9 | 414,81 | -367,24 |
| All Trades # | 1844 | 1500 | 344 |
| Profitable Trades Ratio | 0,55 | 0,58 | 0,44 |
| Winning Trades # | 1019 | 867 | 152 |
| Losing Trades # | 825 | 633 | 192 |
| Average Trade | 0,93 | 2,6 | -6,36 |
| Average Winning Trade | 10,72 | 9,63 | 16,91 |
| Average Losing Trade | -11,16 | -7,03 | -24,78 |
| Avg. Win/ Avg. Loss Ratio | 0,96 | 1,37 | 0,68 |
| Average Profit per Share | 0,03 | 0,1 | -0,15 |
| Max Conseq. Winners | 19 | 20 | 5 |
| Max Conseq. Losers | 17 | 20 | 9 |
1. Open positions at 9.32
The Deltix Quantitative Research Team
Latest posts by The Deltix Quantitative Research Team (see all)
- Improving Order Execution in FX – Rethinking TCA - January 26, 2018
- Using Deltix for Trading Cryptocurrencies and Bitcoin Futures - December 11, 2017
- Advantages Of Recording Your Own Market Data - July 8, 2016
