Optimizing Order Execution Using Advanced Execution Analysis

Examining Execution Transaction Costs in LME Metals

Transaction Cost Analysis (TCA) has traditionally been used to examine costs of order executions between different brokers, demonstrate best execution and provide other compliance-based functions. More recent applications of TCA involve forensic analysis of executions. This deeper analysis helps firms improve execution quality in the context of a specific trading strategy. To reflect the deeper analysis and internal focus, we call such studies Advanced Execution Analysis (AXA).

Research Methodology

Over the summer, we embarked on a study with our client, the London-based broker, Marex Spectron. The purpose of the study was to examine different methods of executing orders of six metals on the London Metal Exchange (LME) using an Advanced Execution Analysis approach.

Using Arrival Price (mid-price between bid & offer) as the benchmark, the study looked at whether increasing passivity can reduce transaction costs versus a market order. In addition to market orders, we tested variations in passivity via four different types of limit orders:

  • Limit-Primary Places a limit order at the primary price level (bid for buy orders, offer for sell orders). If this order is not filled after 10 seconds, replaces the limit order with a market order. We use FIFO methodology for the order queue.
  • Limit-MidPrice Places a limit order at the mid-price of the bid and offer, rounding down for buys and up for sells. We assume that our order is the first at that price level. Again, if the order is not filled after 10 seconds, we replace the limit order with a market order.
  • Pegged-Primary Places a limit order at the primary price level and replaces on bid/offer updates. If the order is not filled over various time scales (from 1 second to 1 hour), it is replaced by a market order.
  • Pegged-MidPrice Places a limit order at the mid-price and replaces on bid/offer updates. Again, if the order is not filled over various time scales (from 1 second to 1 hour), it is replaced by a market order.

Marex Spectron provided LME tick data for the six metals for the period March 1 to May 13 2016. This data together with corresponding market depth (order book) data and volume profile data was loaded into Deltix TimeBase. The different execution methods described above were implemented in Deltix QuantOffice and back-tested against the market depth data. The following statistics were computed:

  • Transaction Cost (i.e. The difference between the order execution price and Arrival Price).
  • Standard Deviation of Transaction Costs
  • Average Time to Fill
  • Limit Order Fill %

Results

Defining risk as the standard deviation of transaction costs, we found that:

  • Across all evaluated strategies, the Market execution method has the highest expected transaction cost and the lowest risk associated with it.
  • When using peg intervals of short duration (up to 30-60 seconds depending on the market), the Pegged-MidPrice execution method provides both lower expected transaction costs and risk compared to the Pegged-Primary execution method.
  • Only Pegged-Primary (and not Pegged-MidPrice) demonstrates steady improvement of the transaction cost when using peg intervals of longer duration (above 60 seconds). However, this improvement comes at the cost of additional risk.

An example of results displayed graphically is shown below:

Advanced Execution Analysis - Aluminum Scatter Plot
Aluminum Scatter Plot
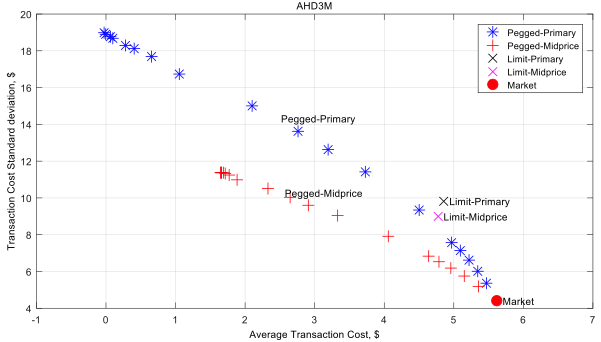
(Source: Marex, Deltix, LME)

The full study is available here.

Practical Considerations

As with any research, the results of one study are useful in providing general direction. However, the results would be significantly more useful if the research is repeated on an ongoing basis. This allows researchers to use market and trade data from different time periods, which will hopefully validate (or possibly repudiate) their results. At a minimum, ongoing research would help to refine their strategies.

For example, we are continuing this research by introducing price prediction heuristics into the pegged order execution methods. The goal is to reduce the risk of the Pegged-Primary method so we can capture the benefit of reduced transaction cost with less downside risk (i.e. standard deviation of transaction cost).

However, any price prediction technique is subject to the danger of curve-fitting. The on-going research approach described above extends the number and scope of out-of-sample testing periods to provide more reliable results.

Ideally, executions are analyzed in real-time. This way, researchers can analyze deviation of transaction costs versus benchmarks in the context of a rolling historical window (say from three months ago to real-time). With such information, traders can immediately identify divergences and execution anomalies compared to the performance of recent executions. This allows them to make necessary adjustments to ongoing executions or pending orders.

As we have discussed before, the holy grail is having fully adaptive execution algos which change their behaviour in real-time in response to real-time market data and actual performance. But the first step is to move from traditional TCA to ongoing detailed research and analysis of executions, so we can incorporate those findings into current trading decisions.

You can download this research study here.

More Insight on How To Do Execution Analysis

This research study is focused on advanced execution analysis rather than alpha generation. We’ll be publishing results of more execution research in 2017, so stay tuned.

In addition, over the summer, we published a couple of articles about approaches for doing advanced execution analysis. Here is a brief blog post discussing the advantages of recording your own market data for execution analysis. Here’s an article from Stuart Farr on DIY Execution Analysis published by CTA Intelligence.

If our research on signal generation is more relevant, you might find these research studies useful:

If you’d like to learn more about the platform used to conduct this research, visit our website or contact us.

Advantages Of Recording Your Own Market Data

Recently, Deltix was spotlighted in two industry publications – CTA Intelligence and e-FOREX. Below are synopses of the two articles and links to view the original articles (no subscription or login needed).

DIY Execution Analysis

The CTA Intelligence Special Report: Managed Futures 2016 included an article by Stuart Farr titled “DIY Execution Analysis.” In the article, Stuart talks about the high cost and potentially undesirable characteristics of purchasing historical market data versus recording your own market data. Unless you’re running a start-up firm, it’s better to record real time market data for use in back-testing and execution analysis (or TCA).

The article discusses multiple advantages of recording your own market data. For example:

  • You can capture all of the latencies and idiosyncrasies inherent in your own infrastructure and market data feeds. This is most important for strategies or analysis (like execution quality) that require tick and market depth data.
  • If you’re doing forensic execution analysis, it is doubly necessary as the time-stamping of orders, executions and market data needs to be fully sequenced. Such forensic execution analysis may not be required on a continuous basis, but is essential when there is an unexpected or unexplained change in execution quality.
  • For orders executed algorithmically, ongoing analysis is useful to track performance of the algos. Analysis can provide comfort or alert to unacceptable changes in execution quality measured in both ticks and dollar value. Time-series analysis of executions can be used to look for patterns of over/under performance and improve execution algo selection and parameterization.
  • A practical key to success is to demonstrably and frequently improve trading performance by fine-tuning execution. There is nothing like showing real dollar improvement to keep researchers, technologists and traders motivated and focused.

Stuart goes into detail about each of these points. You can access the article here (no registration or login required).

Strategy Back Testing Platforms

e-FOREX published an article, “Sharpening the tools of the trade: New Developments with FX Strategy Back Testing Platforms”, that features comments from Ilya Gorelik on the topic of back testing foreign exchange (FX) trading strategies. This article talks about the challenges in signal generation and back testing in FX and how new technologies (e.g. cloud) can assist.

The subject of the e-FOREX article is back-testing only. As Deltix clients already appreciate, it is extremely important to be able to deploy a backtested trading strategy “as is” with no re-coding. This helps to protect the fidelity of actual results versus back-tested results. It also reduces time-to-market and the overall cost of the strategy development and deployment process. Deltix is the only institutional grade platform that provides this full, research-to-live-deployment capability.

You can read this article here (no registration or login required).

The Deltix Product Suite provides end-to-end support of all phases of the alpha discovery process, including data collection and aggregation, model development, back-testing, simulation and deployment to production. Learn more here.

Generating Alpha Using IPO and Secondary Issue Data

The markets are currently in a risk averse state, at least in part as a consequence of rapidly-evolving geopolitical issues and slowing market growth in China. As a result, the IPO and secondaries markets slowed in late 2015 and have remained sluggish in the first quarter of 2016. Nonetheless, companies will still need access to the capital markets this year, even if it is not at a frenzied pace.

Trading IPOs and Secondaries

Results of strategy using Triad IPO Consensus data.Developing a strategy for trading IPOs and secondaries is not trivial. Issuers push the news out to promote their offerings, sometimes resulting in excessive and unfiltered news and hype. This makes it challenging to generate accurate signals for a trading strategy. It can be helpful to have a tool that can track news and provide indications as to whether, and by how much, a stock price is likely to move from its offering price in the first few days of trading.

Triad Securities’ “New Issue Service” provides a select view of IPOs and Secondaries and how they are affected by variables in the global financial markets. It includes proprietary consensus reports indicating the anticipated pricing of IPOs or Secondaries. These reports provide indications on deals, projected first day prices or price ranges on IPOs and a consensus indicator on secondaries.

Triad’s New Issue Service highlights subtle changes in the new issue and secondary markets from the moment of filing through pricing.

Can We Generate Alpha with IPO Consensus Data?

Our Quantitative Research Team sought to determine if there are opportunities to generate alpha in US equities, using Triad data as a basis for market movement prediction after IPO events or after secondaries pricing.

We loaded Triad data and associated market data into Deltix TimeBase and then developed, tested and refined candidate trading strategies in Deltix QuantOffice. The strategies were back-tested on in-sample data for the years 2008-2014, while 2015 data was included for out-of-sample testing.

The Trading Strategies

For the first strategy, based on Triad’s consensus data for IPOs, we entered long or short positions one week after the IPO. For the second strategy, based on Triad’s consensus data for secondaries, we entered long positions only, but hedged the positions with the SPY ETF. Back-testing showed that the two strategies (the first for IPOs, the second for Secondaries) had Sharpe Ratios of 2.11 and 2.73 with average profits per share of $0.20 and $0.09 respectively for the eight years of 2008 to 2015.

Implications of the Research

The results from this research demonstrated that there are opportunities to generate alpha using Triad’s Consensus Data for IPOs and Secondaries. Based on these results, we think firms would find it worthwhile to invest in further research. For example, firms might want to experiment with different time periods after the IPO, various holding periods, different hedging strategies, and/or alternative execution approaches.

QuantOffice makes it easy to implement and back-test these variations. Utilizing QuantServer in addition allows users to deploy the strategies for live simulation and production trading.

You can register and download the research study here.

You might also be interested in the research we published last quarter where we tested whether it was possible to generate alpha using earnings date revisions data from Wall Street Horizons.

Generating Alpha with Earnings Date Revisions from Wall Street Horizon

Introduction

Company earnings are the bedrock of financial analysis and investment. Sell-side, buy-side and independent research analysts perform quantitative and qualitative analysis of companies, their peers and their markets in order to provide guidance for short-term earnings and earnings growth for in-house use or for clients. Innovations in earnings analysis over the last few years have included crowd-sourced earnings estimates (e.g. Estimize) and sentiment derived from the news and social media (e.g. Ravenpack, Social Market Analytics, PsychSignal). The overriding objective of company analysis has been and still is to forecast as accurately as possible a company’s future earnings and so guide asset allocation and trading decisions.

As a software and services firm focused on quantitative research and trading solutions, we are always interested in alternative ways to apply quantitative techniques for trading and investment purposes. This fall, we decided to look at company earnings from a different perspective. This time, we looked at how  calendar events affect forecasts: specifically, we wanted to test whether earnings announcement date revisions can be used for predicting future prices in a manner that could be profitably traded upon.

We reviewed the recent research papers of Joshua Livnat (http://www.wallstreethorizon.com/livnat) and Eric So (http://www.wallstreethorizon.com/So), both of whom look at whether changes in the earnings announcement dates can be used to generate returns.

Research Methodology

We conducted our study using our own research software, TimeBase and QuantOffice. Below are the steps we followed for this research:

  1. We built a data loader to populate TimeBase with the WSH daily snapshots of company future earnings announcement dates for S&P500 stocks for the period January 3, 2006 to September 2, 2015.
  2. We also populated TimeBase with market data for those stocks for the same period. In an actual production deployment of Deltix software, a time series of tick data is automatically recorded through operation of the software for trading. For our research study, we back-populated TimeBase with one-minute bar data.
  3. We now had a base data set on which to apply and test our ideas. Quant researchers use Deltix to express their model ideas as “strategies” in QuantOffice. In the studies by Joshua Livnat and Eric So referenced above, both found that companies who advance their earnings dates generally outperform companies that delay their earnings dates. It is not difficult to rationalize why this might hold true and so we started with this premise and then developed the theme with advanced statistical techniques implemented in QuantOffice.
  4. The resulting model was back-tested as a trading strategy. (In practice, there were of course multiple iterations of the model with each backtest providing our researchers feedback for the next iteration. As each back-test takes seconds to run: the productivity of this iterative approach is very high).
  5. Where both earlier studies modelled a holding period spanning from shortly after the change in date to the actual announcement, we took positions the day before an earnings announcement and sold them the day after, resulting on a holding period of less than 24 hours.
  6. In order to isolate the calendar date effect from any general market effect (although our holding period was less than a day), we also implemented a dollar-neutral version of the strategy.

Results

Our results supported the findings of the previous researchers. Specifically, we found:

  • The most likely positive returns occured when the earnings announcement date was advanced (i.e. brought forward) in the second half of the quarter.
  • Conversely, the most probable negative returns occurred when earnings announcement date was delayed in the first half of the quarter.
  • For both hedged and un-hedged versions of the strategy, for the period January 2006 to September 2015, the back-tested strategies showed Sharpe Ratios of 2.08 (unhedged) and 2.12 (hedged) with average profit per share of 10 cents and 8 cents respectively.

As such, we can conclude that there are profitable opportunities from trading with signals derived from WSH earnings date announcement data.

The P&L curve for the unhedged version of the strategy is shown below:


The full results are included in our research paper.


Practical Applications – Research

One of the impediments to firms seeking alpha in alternative data sources is the time required to get to the point where consideration of the value of such sources can even start. Data is usually delivered as a real-time time stream or, for sample or trial purposes, a flat file. In either case, the raw data has to be populated into an analytical platform duly configured for the data.

By building a set of data loaders (real-time and batch) for our TimeBase data repository, Deltix significantly reduces the time required for setup before analysts can start their research. In addition, QuantOffice has a rich set of analytical libraries which enable quant researchers to focus on implementing their specific logic, rather than having to spend time on the time-series analytics required for such an implementation.

The Deltix Quantitative Research Team invested substantial time to prepare the data loaders and repository for this research study, and it is now available in the Deltix Product Suite. Researchers can access a paid trial in which they can access the data and QuantOffice strategy and modify it for their own purposes.

Practical Applications – Trading

Both Livnat and So generated long and short positions from soon after the date of the revision to just after the actual earnings announcement. Both found that positive returns can be generated from taking long and short positions, but both also found that the majority of returns generated from taking positions in advance of the actual earnings occurred on or around the actual EPS announcement. The strategy suggested in our research therefore focused on taking positions just before to just after the earnings announcement (holding period less of than 24 hours). This short-term holding period suggests that institutional managers could implement tactical trading around core positions in a portfolio in addition to outright portfolio construction.

To review the detailed research study, click here.


To get more information about the products used to conduct this research, follow the links below:

TimeBase
QuantOffice
QuantServer


To learn more about the paid trial that provides access to the strategies and data used in this research, click here.

Can You Generate Alpha in US Equities Using Corporate Reputation?

Corporate Reputation Data

The Corporate Reputation Index (CRI), developed by Seldonix and distributed in partnership with Social Market Analytics, allows traders to identify and compare over- and under-priced stocks that are affected by a company’s actions. Corporate Reputation is the controllable portion of a company’s stock price, considered to be an intrinsic driver of company performance, and a major contributor to daily stock price fluctuation.

The Corporate Reputation Index is the first daily business metric for monitoring corporate reputation. Centered on “0”, companies with negative values are deemed undervalued relative to market while those with positive values are overvalued.

The CRI is created after the close of markets and is currently available before markets open the next day at any time after 9:00 PM Eastern US Time the night before.

Each data record features a set of fields:

  • The timestamp associated with each field is the market close date of the data used;
  • Symbol;
  • CRI

Basis of Research using Seldonix data

The purpose of the research described in this paper is to determine if there are opportunities to generate alpha in US equities traded on the NYSE and NASDAQ using Seldonix data as a basis for daily market movement prediction (the holding period is about 6.5 hours).

We show how with the use of simple technical indicators and the popular conception of basket trading, we can exploit the CRI to generate excess returns. An evaluation of the CRI was conducted in the forecasting of stock price. The results of the testing showed a 1 – 8 day lag in the prediction of stock price, depending on the stock. Therefore our purpose is to determine the most appropriate time when the CRI generates the most suitable values for opening a position. As the CRI values change every day and are different for each ticker, we need to construct an approach which will successfully encompass both equally important collations. To identify these situations, we need to:

  • Compare short-term values to long-term;
  • Compare values within the considered universe of tickers.

The full paper can be accessed here.

Results

This approach gives the following results for S&P 100 tested on the period from 1/5/2010 to 8/18/2014:

ParameterAll TradesLong TradesShort Trades
Net Profit/Loss21,182.8213,984.977,197.85
Total Profit113,708.7159,129.8054,578.91
Total Loss-92,525.89-45,144.83-47,381.06
Cumulated Profit %21.18 %13.98 %7.20 %

Max Drawdown-2,590.71-2,774.62-2,265.55
Max Drawdown %-2.41 %-2.66 %-2.18 %
Max Drawdown Date9/2/20119/30/20119/15/2011
Return/Drawdown Ratio8.185.043.18
Drawdown Days %80.96 %80.36 %88.29 %
Max Drawdown Duration119198188

CAGR4.40 %2.97 %1.57 %
Sharpe Ratio1.731.370.73
Annualized Volatility2.542.162.15
Sortino Ratio2.862.151.13
UPI0.390.270.13
Information Ratio1.711.370.72
Optimal f68.3263.5133.96

All Trades #230811661142
Profitable Trades Ratio0.530.540.52
Winning Trades #1229634595
Losing Trades #1079532547

Average Trade9.1811.996.30
Average Winning Trade92.5293.2691.73
Average Losing Trade-85.75-84.86-86.62
Avg. Win/ Avg. Loss Ratio1.081.101.06
Average Profit per Share0.040.050.03

Max Consequent Winners  9119
Max Consequent Losers10109


Rules for closing

The other idea is to exploit the CR trend not only for opening but for closing position. On the figure below you can see the example of position on AAPL chart, blue line on second pad indicates CRI values:

We use the Simple Moving Average (SMA) of the last CRI values (red line on the second pad) to determine whether the instrument gets over or underpriced. Using the model from the paragraph Over/Under Priced, we will close the position for the instrument according to following rule:

  1. If CR > SMA (5, CR) (instrument is overpriced at time t, price is likely to return to suggested price at t+1) close Short position on day close;
  2. If CR < SMA (5, CR) (instrument is underpriced at time t, price is likely to return to suggested price at t+1) close Long position on day close.

The same chart with this rule shows better results:

This approach gives the following results for S&P100 tested on the period from 1/5/2010 to 8/18/2014:

ParameterAll TradesLong TradesShort Trades
Net Profit/Loss32,118.4918,265.4113,853.08
Total Profit143,984.7571,784.7972,199.96
Total Loss-111,866.26-53,519.38-58,346.88
Cumulated Profit %32.12 %18.27 %13.85 %

Max Drawdown-3,526.80-4,508.75-3,368.95
Max Drawdown %-3.08 %-4.22 %-3.07 %
Max Drawdown Date9/2/20119/30/20119/15/2011
Return/Drawdown Ratio9.114.054.11
Drawdown Days %80.45 %81.83 %88.63 %
Max Drawdown Duration95194279

CAGR6.44 %3.83 %2.95 %
Sharpe Ratio1.971.310.94
Annualized Volatility3.272.933.14
Sortino Ratio3.402.061.55
UPI0.580.260.19
Information Ratio1.901.310.91
Optimal f60.0544.6329.93

All Trades #219011031087
Profitable Trades Ratio0.530.550.51
Winning Trades #1158603555
Losing Trades #1032500532

Average Trade14.6716.5612.74
Average Winning Trade124.34119.05130.09
Average Losing Trade-108.40-107.04-109.67
Avg. Win/ Avg. Loss Ratio1.151.111.19
Average Profit per Share0.060.070.05

Max Consequent Winners131616
Max Consequent Losers11915


Filter for stronger signal

One more idea is to filter a stronger signal when CR retains its sign from the previous day, which is a stronger signal indicating overpriced/ underpriced asset. On the chart below you can see two trades on MSFT asset, the second one is unprofitable, when the CR line changes its value from -1 to 1:

Filtering out such unstable situations gets the following results for the S&P 100 tested in the period from 1/5/2010 to 8/18/2014:

ParameterAll TradesLong TradesShort Trades
Net Profit/Loss32,810.1219,145.4513,664.67
Total Profit126,322.9964,003.7262,319.27
Total Loss-93,512.87-44,858.26-48,654.61
Cumulated Profit %32.81 %19.15 %13.66 %

Max Drawdown-2,617.49-4,409.37-2,465.16
Max Drawdown %-2.37 %-4.18 %-2.29 %
Max Drawdown Date9/2/20119/30/20119/15/2011
Return/Drawdown Ratio12.534.345.54
Drawdown Days %78.38 %80.02 %86.74 %
Max Drawdown Duration89194176

CAGR6.56 %4.00 %2.91 %
Sharpe Ratio2.161.491.03
Annualized Volatility3.042.682.84
Sortino Ratio3.822.451.70
UPI0.670.260.24
Information Ratio2.111.501.01
Optimal f70.8055.5136.20

All Trades #1839937902
Profitable Trades Ratio0.530.550.51
Winning Trades #972512460
Losing Trades #867425442

Average Trade17.8420.4315.15
Average Winning Trade129.96125.01135.48
Average Losing Trade-107.86-105.55-110.08
Avg. Win/ Avg. Loss Ratio1.201.181.23
Average Profit per Share0.070.080.06

Max Consequent Winners121211
Max Consequent Losers111016


Conclusion

We presented an approach that uses CR indices as a strong predictive factor of price directionality. We developed a trading strategy that implements an algorithm based on this approach. We also constructed two other versions, both based on CRI predictive power, that raise the performance of the main approach.

The main contribution of the paper is back-testing and comparison of the different versions of the strategy. On stocks in the S&P 100, back-testing shows that the first strategy has an average Information Ratio of 1.71 over the period 2010-2014, the second and third versions achieved Information Ratios of 1.90 and 2.11 respectively, which indicates that the CRI is predictive in the forecasting of stock returns.